
Collecting and presenting data
Collecting and presenting data
These guidelines do not presuppose that a perfect experiment or an ironclad conclusion exists. In fact, variation between studies and experiments is an important source of new discoveries. For this reason it is important to report data and experimental conditions as fully and transparently as possible both to verify findings and also to help future researchers identify sources of variation and anomalies.
Depending on the research question being asked or experimental system being used, some of the following “best practices” may not be feasible or appropriate for your study. In that case, exercise the “best practice” of explaining and justifying any deviation from the norm.
The basics
Your gels and blots should show appropriate context: Gels and blots should not be excessively cropped, any spliced-out lanes should be clearly marked, and positions of any molecular weight markers should be clearly indicated. Ideally, you should indicate the position of a molecular weight marker above and below the band(s) of interest. |
N values, including those for technical and biological replicates, should be clearly stated and explained. Whenever possible, use scatter plots rather than bar graphs. |
Clearly indicate what any error bars represent (standard deviation or confidence interval). Standard deviation is preferred as it shows the variability of the data. |
Make sure that any quantification method used, including densitometric quantification of images, is within the linear range afforded by that method. |
Images should be of sufficient quality and resolution. |
Descriptions of biological materials
Papers should describe biological materials with enough information to uniquely identify materials, including catalog numbers and repository accession numbers, when available. Consider using Research Resource Identifiers (RRIDs), unique machine-readable and searchable identifiers, to report which reagents and tools were used. Make sure to keep track of the following information as you perform experiments.
Antibodies. Include sources, dilutions, and validation criteria.
Define species of origin and source of all antibodies used, including catalog/lot numbers.
Describe how novel antibodies were generated, including preparation and purification of epitope/antigen.
Describe data supporting antibody specificity, including post-translational modifications or neoepitopes.
If possible, demonstrate loss of immunoreactivity following genetic or other molecular modification to the antigen.
Cell lines. Include information about cell line source, derivation, authentication, and contamination (such as mycoplasma) status.
Cell lines should be checked against the ICLAC commonly misidentified or contaminated cell lines database.
Specify method used to authenticate cell lines.
Animals. Specify animal source, species, strain, sex, age, and relevant details of husbandry. For transgenic animals, specify the genetic background.
Quantitative data and statistics
Quantitative data must be reported transparently to ensure reproducibility and enable discovery. Find more information about the rationale for these recommendations in the Editorial: Transparency is the Key to Quality.
Clearly define replicates. How many technical and biological replicates were performed during how many independent experiments? How is the replication represented by the data points shown in figures? Report this information in the methods section and include relevant details in figure legends.
If you choose to show representative data from several independent experiments or assays, indicate where the remaining data can be found.
If a well-established and supported community database where you can upload your data does not already exist, ensure the long-term availability of your data by depositing it in a database such as Zenodo, Dryad, or Figshare and report the corresponding doi.
Excluded data. State whether any data were excluded from the quantitative analyses. If so, indicate the reason and criteria for exclusion.
Bar graphs. Simple bar graphs to report mean±SEM values are not generally permitted: authors should super-impose a scatter plot to report the reproducibility of independent biological replicates within such data sets, and report mean±S.D. values to make the distribution and variation transparent.
Line graphs: Data points on all line graphs should be shown as the mean±S.D.
Randomization. Indicate whether and how samples were randomized during analysis and processing.
Testing for statistically significant differences. Tests used to determine whether differences between data sets are statistically significant should be precisely and fully described. The exact p-values should be reported. Comparisons of more than 2 data sets from the same experiment should be done with an appropriate 1- or 2-way ANOVA with specifically defined post hoc tests. The results of all statistical comparisons between experimental groups should be fully reported in each figure legend (or in a separate supplementary table), including exact p values where appropriate.
Additional resources and guides on statistical analyses may be found on the Graphpad website (please note that the JBC does not specifically endorse the use of this software).
Image data
Figure preparation begins when you collect your image data, so it is worth your time to get this right from the outset. Questions regarding image validity can lead to delays in publication, corrections to published articles, or retractions of articles.
Read JBC's Due Diligence columns for detailed advice and commentary on figure preparation.
General considerations
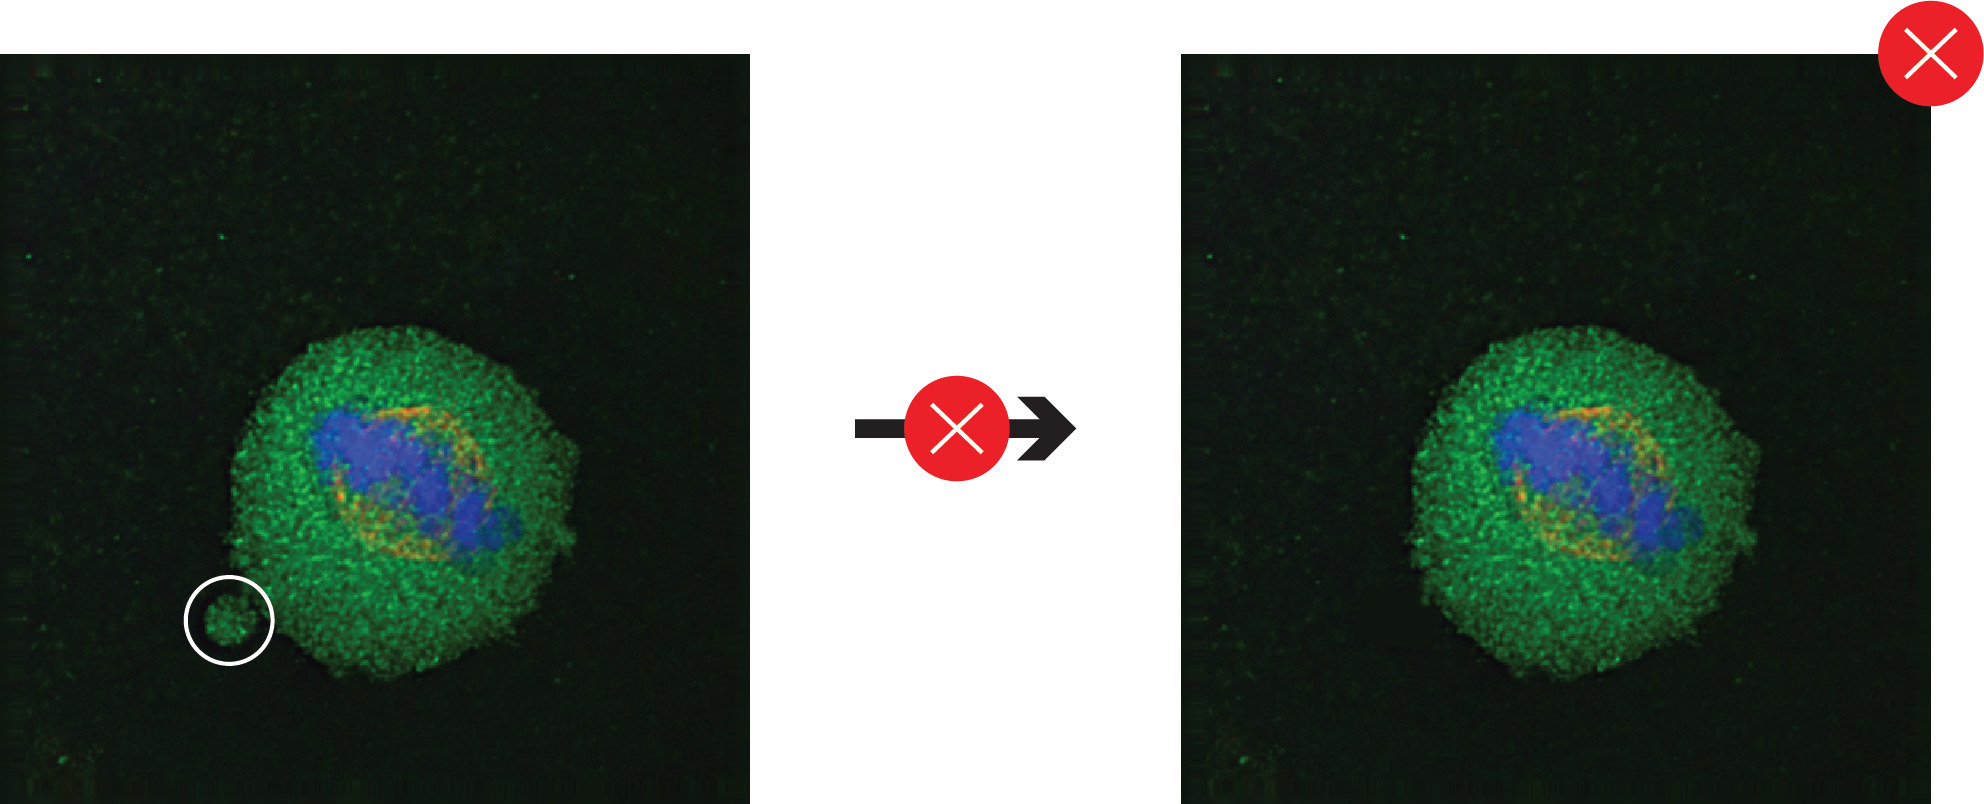
No specific feature within an image may be enhanced, obscured, moved, removed, or introduced. Blemishes, stray marks, and so forth are a hallmark of true data.
Adjustments of brightness, contrast, or color balance are acceptable if they are applied to every pixel in the image and as long as they do not obscure, eliminate, or misrepresent any information present in the original, including the background. Nonlinear adjustments (e.g., changes to gamma settings) must be disclosed in the figure legend.
Images should not be under- or over-exposed and should be saved at an appropriate resolution.
Do not prepare images in PowerPoint or save them in JPEG format.
If scanning images with a flat-bed scanner, scan with a minimum resolution of 300 dpi with no adjustments.
Microscopy data should be collected and presented with a magnification necessary to clearly illustrate the findings and include scale bars.
Record the following information regarding microscope image acquisition:
Make and model of microscope
Type, magnification, and numerical aperture of the objective
Temperature
Imaging medium
Fluorochromes
Camera make and model
Acquisition software
Any software used for image processing subsequent to data acquisition. Please include details and types of operations involved (e.g., type of deconvolution, 3D reconstitutions, surface or volume rendering, gamma adjustments, etc.)
If you export files from a microscope or other acquisition device, be sure to use consistent file formats (8 bit, 16 bit, etc.).
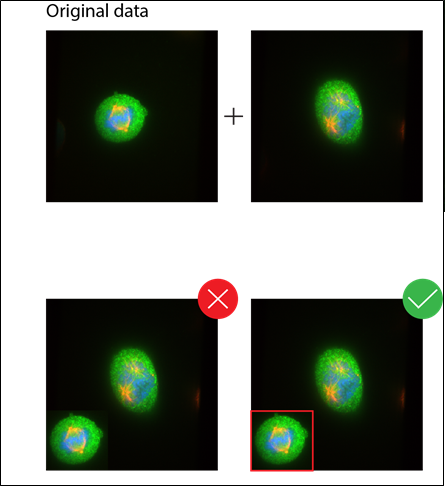
Images that are a composite of separate images should have the borders of original images clearly marked.
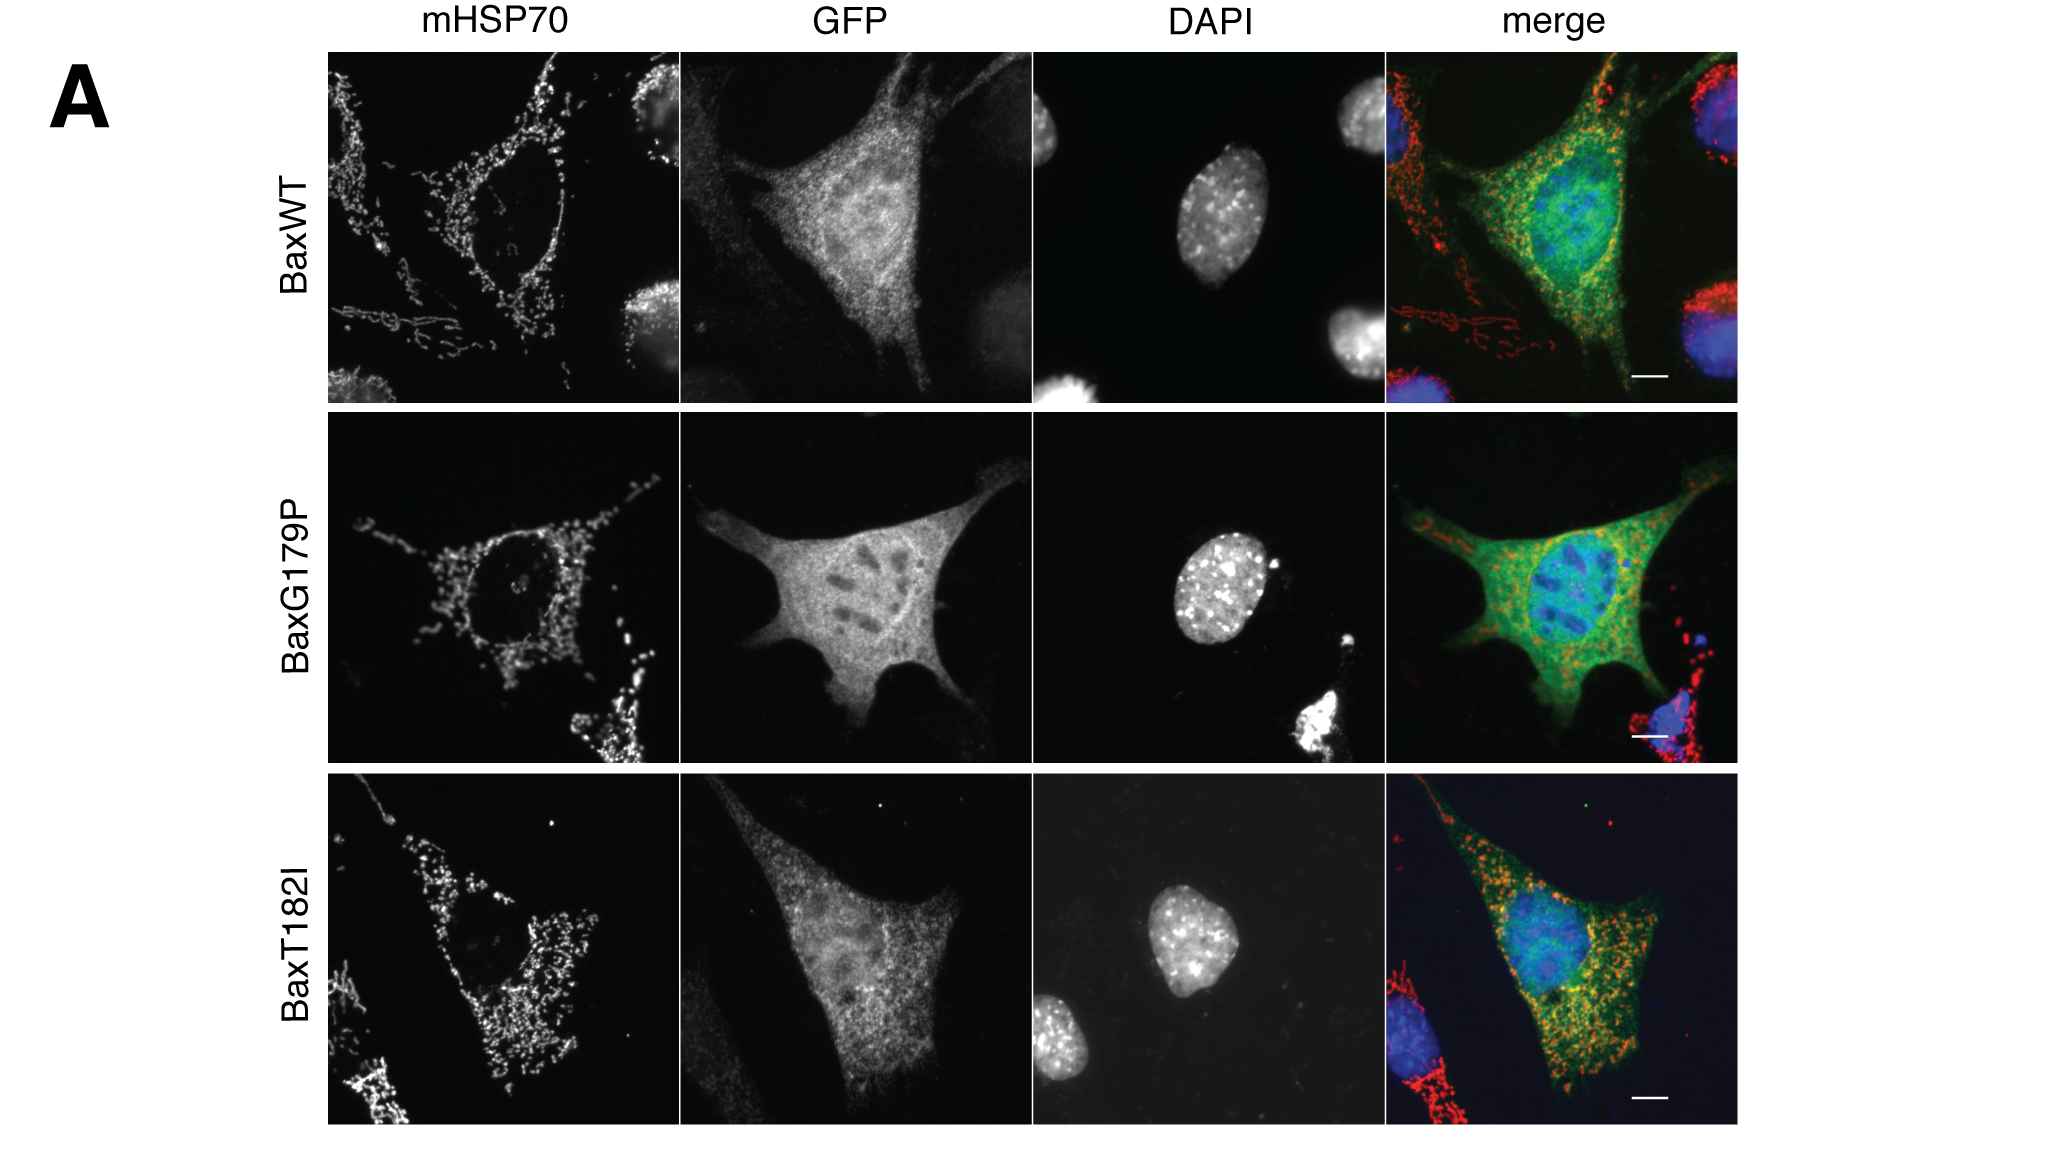
Co-localization of two or more signals from different fluorophores or stains should be supported by merged images from the channels at a resolution sufficient to distinguish the features of interest.
Fluorescence images should show signals from individual channels in gray scale to reveal the full dynamic range of intensities, and to allow color-blind individuals to appreciate your data. Merged images should be presented in color, with distinct colors for individual channels.
Quantitative statements regarding the cellular distribution of molecules or changes in their levels should be supported by quantification of corresponding regions.
When quantifying, make sure the exposure used leads to a signal that is within the linear range afforded by that method.
In the case of fluorescence images using primary antibody and secondary antibody combinations, controls such as a non-immune antibody, omission of the primary antibody, and absence of antigen may be necessary to demonstrate specificity.
Criteria for image selection and analysis should be clearly explained, and data should include numbers of replicates and appropriate statistical analyses to determine significance.
Blot images and quantification
Gels provide a perfect blank canvas to test a variety of scientific questions, but the meaning behind those bands is lost without proper context. Follow the guidelines below to make sure your results are clear and convincing.
The source of all antibodies should be provided, with catalog, lot and RRID numbers where appropriate. The steps taken to validate the specificity of the antibody should be described.
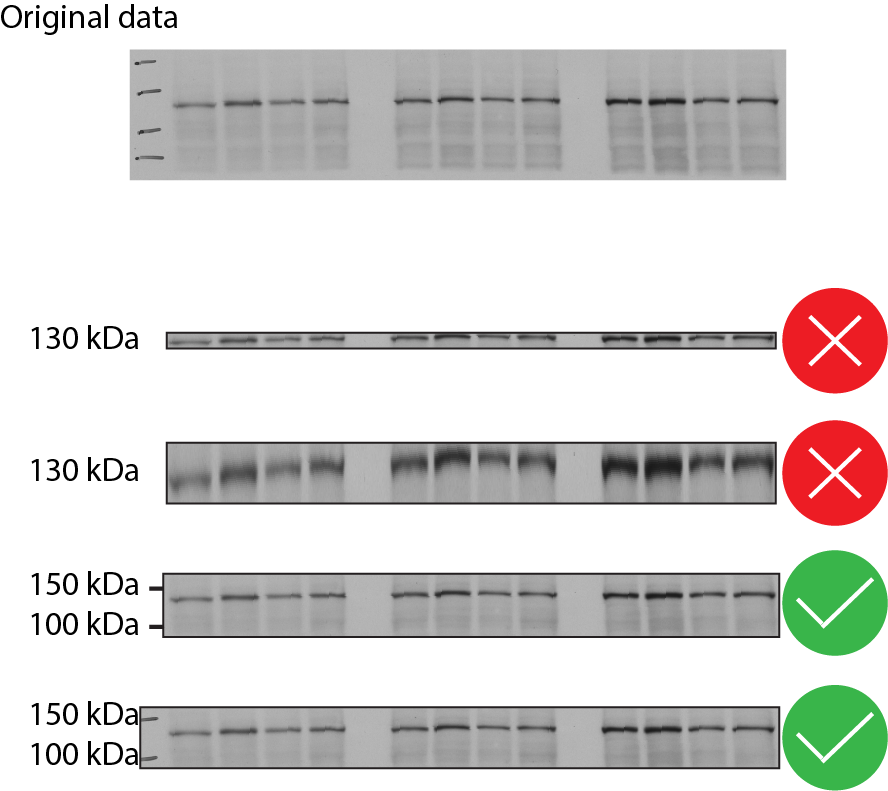
Blots should show full tonal range. A loss of tonal range is a loss of data.
Crop immunoblots in a way that retains information about antigen size and antibody specificity.
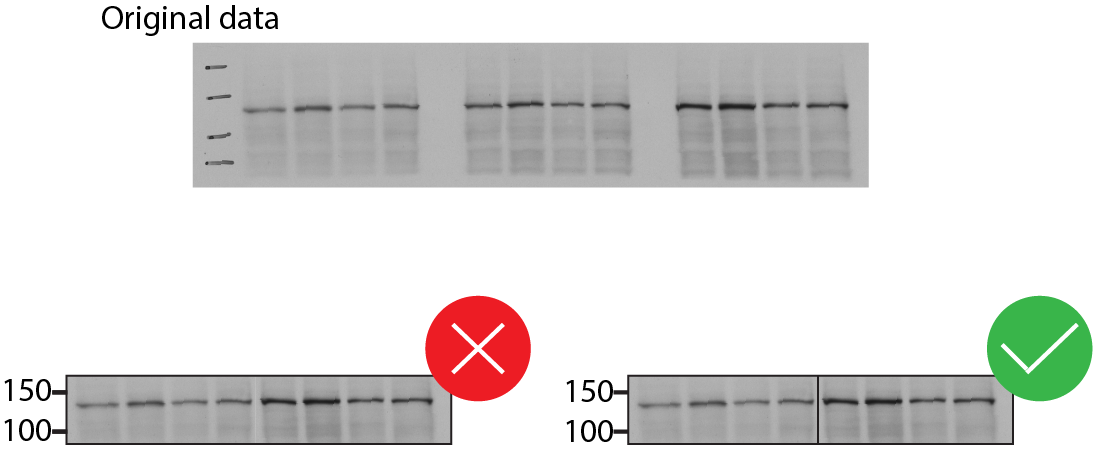
Include positions of molecular weight markers above and below the band(s) of interest. (Example below.)
Avoid assembling figures of blots by splicing lanes from different sections of a gel. If blots must be spliced, borders must be clearly marked and explained in the figure legend (see example below). Splicing between different blots or gels is not allowed.
If blots are quantitatively analyzed, record how data were obtained, whether signal intensity was linear with antigen loading, and how protein loading was normalized. Some detection methods (e.g., ECL) have a very limited linear range.
Normalize signal intensity to total protein loading (assessed by staining membranes for total protein) whenever possible. “House-keeping” proteins should not be used for normalization without evidence that the experimental manipulations do not affect expression.
Antibodies that recognize post-translationally modified proteins should be normalized to total levels of the target protein.
EXPERIMENTAL STRUCTURES BASED ON PHYSICAL AND RELATED DATA
Data for new NMR spectroscopy, X-ray crystallographic or cryo-electron microscopy structures must be deposited in the Protein Data Bank (NMR and X-ray) and/or Electron Microscopy Data Bank (electron microscopy). Furthermore, it is strongly encouraged to provide all cryo-EM raw data via submission to EMPIAR.
All sequence specific chemical shift assignments for backbone and/or side chain assignments (as well as methyl group chemical shift assignments) must be deposited to the Biomolecular Magnetic Resonance Data Bank (BMRB).
Studies using small-angle scattering (X-ray or neutrons) must be deposited in the Small Angle Scattering Biological Data Bank (SASBDB). Authors should also follow the International Union of Crystallography (IUCr) guidelines on how to report SAS data (see Acta Cryst. (2017), D73, 710-728).
For manuscript review, a full validation report for each structure must be submitted. No manuscript with structural data will be sent to review without such report.
All submission must be either made publicly available upon submission or when the manuscript is accepted for publication. No data are to be withdrawn from the any of the above-mentioned Data Banks once a paper has been accepted to the JBC and published as a Paper in Press article.
COMPUTED STRUCTURAL MODELS
Authors must deposit PDB files of computed structural models at ModelArchive with additional required information so that they can be accessed (via the provided doi) like any experimental structure.
JBC submissions containing AlphaFold/RosettaFold predicted structures must be accompanied by a supplementary figure showing an overlay of at least the five best (better 20) models to provide readers with insight into uniformity of the prediction. In addition, single (best) AlphaFold/RosettaFold structure must be shown in colors of pLDDT values. Per the current convention, different colors should be used to highlight predicted regions with high accuracy (pLDDT>90), good backbone predictions (pLDDT between 70 and 90). Regions with pLDDT between 50 and 70 are low confidence and should be treated with the needed caution. The positions of any mutations made in the study should be clearly indicated on this image.
A low confidence prediction cannot be correlated with an intrinsically disordered region of a protein, which can currently be best predicted using sequence-based programs (such as IUPRED among many others).
Overlays of experimental (e.g. from cryo-EM or X-ray crystallography) and computed structures must show the entire experimental structure and predicted model and not just a part that aligns well, so reviewers and readers can independently judge the overall similarity.
Chemicals
Papers describing the activity of synthetic or natural chemical entities must include the chemical structures of such molecules as systematic names, drawn structures, or both.
For synthesized chemicals, a synthetic protocol should be provided, generally as part of the supporting information. Alternatively, reference to a publication or issued patent that includes full synthetic details can be provided.
For isolated chemicals, methods for extraction/purification of the chemical and determination of its structure should be provided in the methods section.
Enzyme activity data
Papers reporting kinetic and thermodynamic data should include the identity of the biomolecule(s), relevant biological information (e.g., species and tissue normally found in, any post-translational modifications), preparation and criteria of purity, assay conditions, methodology, activity, and all other information relevant to judging the reproducibility of the results. The guidelines from the Beilstein Institut/STRENDA Commission have more details and suggestions to keep in mind as you are performing experiments and preparing your manuscript.
Enzyme activity (steady-state) generally should be reported in terms of kcat (Vmax divided by molar enzyme concentration); Vmax per time is also acceptable. Km units are given in molarity.
Any other units of activity (absorbance, % change) should be converted to units of molarity to express kcat or Vmax. Values of kcat (Vmax) and Km should be estimated using nonlinear fitting (and the software system cited).
Parameters should include estimates of error (SD preferred). The use of linear transformations for calculation of Michaelis-Menten parameters is recognized to be inaccurate. The use of any linear transformations should be justified (e.g., graphical presentation of inhibition).
A lack of activity should be defined in terms of a limit of detection. In a series of comparisons to a basal or control level of activity (e.g., set as unity or 100%), this activity should be indicated, in the units mentioned above, along with estimates of error. The inclusion of examples of some of the raw data is encouraged.
Ki values are preferred to IC50.
Datasets can be submitted to the STRENDA database, which is an electronic validation and storage system for functional enzyme data and provides a search repository for standardized enzyme kinetics data, which can benefit a larger research community. If an author chooses to submit kinetic data to STRENDA DB, the data become publicly available only after the corresponding article has been published. Additionally, authors can report new functional results to UniProtKB, a resource of protein sequence and functional information, so the description of their protein of interest is up to date.
-Omics datasets
Authors of papers that include -omics data should comply with ASBMB guidelines.
Animal studies
Report animal source, strain, sex, age, and details of husbandry.
State whether studies were blinded or not. If so, indicate the method and extent of blinding.
Ensure that all research has been reviewed and approved by an Institutional Animal Care and Use Committee and include a statement to this effect in the experimental procedures section of the manuscript. Consult the ARRIVE guidelines for reporting animal research.
Human studies
All studies involving human subjects must be approved by the appropriate review board(s) and abide by the Declaration of Helsinki principles; include a specific statement declaring approval and Helsinki compliance in the experimental procedures section. Do not provide any identifying information (e.g., names, true initials, recognizable images) unless the information is essential for scientific purposes and the patient (or patient’s parent/guardian) gives written informed consent for publication. If the patient is deceased, then the authors should seek consent from a relative. Many journals will ask you to demonstrate you have received this consent by completing and uploading a consent form as part of your manuscript files.
Gene expression and genetic manipulation
CRISPR/Cas
Include appropriate controls for CRISPR/Cas experiments, such as results from two or more guides and two or more independent clones. Experiments in cells, including induced pluripotent stem cells, should include an isogenic control with cells that retain a wild-type allele.
Verify CRISPR/Cas-mediated insertion/deletions by sequencing and show loss of the protein by immunoblotting, if antibodies are available. When antibodies are not available, changes in RNA expression should be validated by quantitative RT-PCR.
RNAi
RNA interference (RNAi) experiments should include at least two different siRNAs that are complementary to different portions of the target gene and control siRNAs with sequences altered from the target.
Significant depletion of target gene expression by siRNAs should be demonstrated by measurements of target protein or mRNA, and can also be addressed by rescue experiments involving expression of target gene sequences refractory to siRNA.
Gene expression
Studies that assess the biological effects of changes in gene expression that are based on measures of RNA levels (e.g., RNA-seq, microarrays, QT-PCR) should also have supporting evidence to confirm that the changes in RNA levels have functional consequences.
Microarrays
Microarray data should be deposited in a public database compliant with the MIAME guidelines (Minimum Information about a Microarray Experiment; see below), for example GEO or ArrayExpress. Information in bold should also be described in the methods section of the manuscript.
The raw data for each hybridization (e.g., CEL or GPR files)
The final processed (normalized) data for the set of hybridizations in the study (e.g., the gene expression data matrix used to draw the conclusions from the study)
The essential sample annotation including experimental factors and their values (e.g., compound and dose in a dose response experiment)
The experimental design including sample data relationships (e.g., which raw data file relates to which sample, which hybridizations are technical, which are biological replicates)
Sufficient annotation of the array (e.g., gene identifiers, genomic coordinates, probe oligonucleotide sequences or reference commercial array catalog number)
The essential laboratory and data processing protocols (e.g., what normalization method has been used to obtain the final processed data)
FACS data
Appropriate FACS analysis procedures should include multiple parameters and/or time points to establish biological states.
See also recommendations from the International Society for Advancement of Cytometry regarding Minimum Information About a Flow Cytometry Experiment.